Stock Code: 831045
Industrial Automation & Intelligence Solutions
SUMMERY: The Number Most Shops Get Wrong A fabrication manager comparing an automatic pipe welding system to manual welding usually starts with welding speed. That’s the wrong starting point. Travel speed tells you how fast the torch moves. It ...
A fabrication manager comparing an automatic pipe welding system to manual welding usually starts with welding speed. That’s the wrong starting point.
Travel speed tells you how fast the torch moves. It does not tell you how many joints you finish per shift. The gap between those two numbers is where productivity calculations go wrong, and where equipment purchase decisions get made on incomplete information.
The correct starting point is cycle time per joint: everything that happens between the pipe being ready to weld and the joint being ready for the next operation. That includes fit-up verification, system mounting, welding passes, interpass inspection, and — critically — rework. An automatic pipe welding system that welds twice as fast but requires 30 minutes of setup per joint can lose to a manual welder on low-volume work. The calculation has to capture the whole cycle, not just the arc.
This guide provides a reusable calculation framework. The formulas are standard. The example numbers are illustrative estimates, not measured data from any specific customer. Plug in your own shift length, labor rates, and repair rates, and the output becomes your decision tool.
Productivity calculation starts with four time components per joint:
Set-up time (t_set). The time to position the track welding machine or magnetic carriage, mount the torch, and verify alignment. On a track system, this includes rail installation and concentricity check. On a magnetic circumferential weld carriage, it is limited to placement and adhesion verification.
Welding time (t_weld). The time the arc is actually lit, summed across all passes. This is not the same as travel time around the circumference — it includes root, fill, and cap passes, each with its own travel speed and oscillation settings.
Repositioning time (t_repos). Between passes, the torch height and angle may need adjustment, especially on multi-pass circumferential weld joints. On a programmable auto carriage welding machine, this can be partly automated; on a manual or semi-automatic setup, it is operator time.
Repair time (t_repair). The expected rework time, weighted by the repair rate. This is the component most often omitted from productivity calculations, and it is often the largest differentiator between manual and mechanized systems.
The cycle time per joint is:
T_cycle = t_set + t_weld + t_repos + (t_repair × repair rate)
This formula is deliberately simple. It forces the calculation to include every component that consumes shift time. A track welding machine that welds fast but repairs often may lose to a slower system with a lower repair rate — and the formula makes that visible.
A second formula is useful when you need to estimate welding time from first principles rather than from observed cycle time. Welding time can be estimated by dividing the weld mass by the deposition rate and duty cycle, then adding set-up and take-off time:
t_w = m_w / (D_r × D_c) + t_set
where m_w is weld mass, D_r is deposition rate, D_c is duty cycle, and t_set is set-up time.
This formula is more sensitive to process parameters. Deposition rate for manual MMA is roughly 3 kg/h; for mechanized MAG or SAW, it is 5 kg/h or more. Duty cycle for manual MMA is typically 15–30%; for mechanized SAW, it can reach 80–90%. The formula is useful for estimating welding time before you have cycle-time data, but it assumes you know the weld volume and the deposition rate. For productivity comparisons between automatic pipe welding and manual work, the cycle-time formula is more practical because it captures the non-welding time that dominates on large-diameter joints.
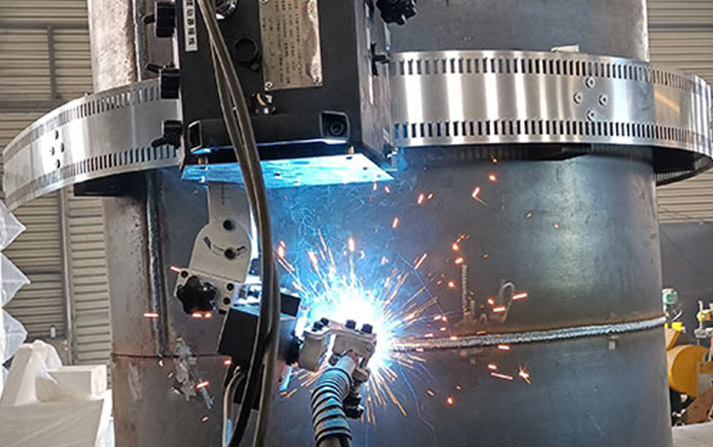
The following numbers are estimates for illustration. They are not measured data from any customer. Replace them with your own observed times and rates.
| Variable | Manual SMAW | Track Welding Machine | Magnetic Track Welder |
|---|---|---|---|
| Pipe size | 24 in, 19 mm wall | 24 in, 19 mm wall | 24 in, 19 mm wall |
| Set-up time per joint | 5 min | 25 min | 5 min |
| Welding time (all passes) | 95 min | 55 min | 60 min |
| Repositioning between passes | 10 min | 5 min | 8 min |
| Repair rate | 4% | 1% | 2% |
| Repair time per defect | 40 min | 40 min | 40 min |
| Effective shift minutes | 480 | 480 | 480 |
The set-up time difference is the first point of comparison. A track welding machine needs rail installation and alignment; a magnetic circumferential weld carriage attaches directly and skips that step. On a single joint, the track system’s setup overhead is a disadvantage. On a production run of 50 identical joints, the setup amortizes, and the track system’s lower welding time and repair rate take over.
Using the formula:
Manual: 5 + 95 + 10 + (40 × 0.04) = 111.6 min per joint → 480 ÷ 111.6 ≈ 4.3 joints per shift
Track welding machine: 25 + 55 + 5 + (40 × 0.01) = 85.4 min per joint → 480 ÷ 85.4 ≈ 5.6 joints per shift
Magnetic track welder: 5 + 60 + 8 + (40 × 0.02) = 73.8 min per joint → 480 ÷ 73.8 ≈ 6.5 joints per shift
The automatic pipe welding productivity advantage is real, but it is not the 7x often quoted from pipeline case studies. That number comes from high-volume mainline spreads with optimized logistics. On a shop floor with mixed work, the advantage is smaller and more dependent on how well the setup time and repair rate are controlled.
The magnetic track welder wins on this example because it combines fast setup with a moderate repair rate. The track welding machine wins when the joint count is high enough to amortize the 25-minute setup — for example, 50 or more identical joints. The manual process remains competitive on low-volume, high-mix work where neither automated system can justify its setup time.
The calculation is not a verdict on which machine is “better.” It is a verdict on which machine fits a specific production pattern. A shop running 4 joints per shift of varied sizes should not buy a track system based on its welding speed alone. A shop running 100 identical joints per week should not dismiss the track system because of its setup time.
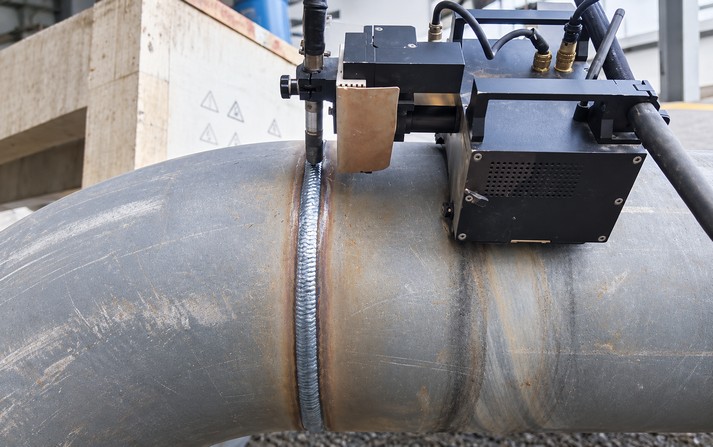
A 1% repair rate sounds small. On a joint with a 40-minute repair time, it adds 0.4 minutes to the average cycle. That seems negligible — until the repair happens during a shift with no slack.
On a 36-inch line, a single repair can stop the spread for a full shift. The cycle-time formula averages the repair time across joints, but the operational reality is that repairs cluster. A circumferential weld defect that requires rework consumes not just repair time but also inspection time, grinding time, and schedule recovery.
The repair rate difference between manual and mechanized welding is well documented. Manual SMAW on large-diameter pipe typically holds 80–90% first-pass acceptance, while mechanized systems reach 95–99% in comparable conditions. On an orbital copper-nickel firewater project, the reject rate dropped from 15% manual to 5% orbital — a 67% reduction. The automatic pipe welding productivity gain from lower repair rates is often larger than the gain from faster travel speed.
The repair rate is the variable you can measure most reliably. Pull the last 100 inspection reports from your shop. Count the repairs. That number is your baseline. Then estimate what a track welding machine or auto carriage welding machine would produce based on manufacturer reference data or a trial run. The difference in repair rate, multiplied by repair time, is the productivity gain that rarely appears in equipment brochures.
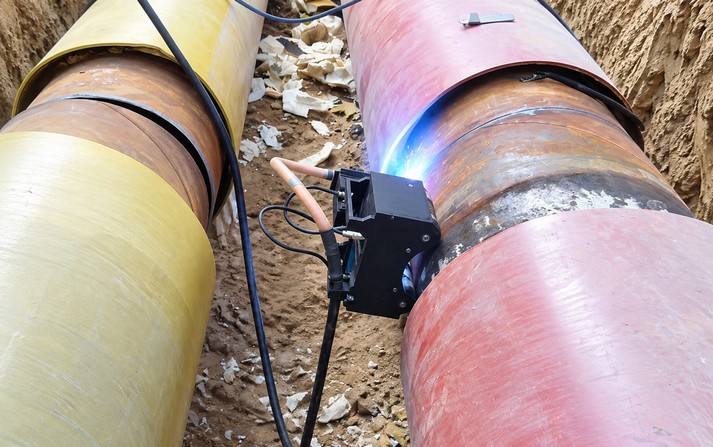
Productivity is an input to the investment decision, not the decision itself. The simple payback formula is:
Payback (shifts) = Equipment cost / (Productivity gain per shift × Value per joint)
The “value per joint” is the contribution margin — labor saved, rework avoided, and schedule time recovered. For a shop, it is the difference between the cost of welding the joint manually and the cost with the automated system, multiplied by the joint count.
Mechanized pipeline systems cost roughly $150,000 to $500,000 per spread, but lower labor per joint and less rework recover the difference after approximately 15 to 30 kilometers of mainline pipe. On high-volume pipeline work, payback is typically 1–3 years, with break-even around 300–500 girth welds on 16-inch and larger pipe. Research on pressure piping fabrication found a two-year payback under optimal workload conditions, with fabrication time reductions up to 73.7% for larger pipe diameters and reject rates falling below 1%.
These numbers vary by workload and labor rate. A shop running one shift of mixed work will not see the same payback as a three-shift spool fabrication operation. The formula is the same; the inputs are not.
The cycle-time and payback formulas do not capture three factors that often determine whether a track welding machine or magnetic track welder succeeds in a shop:
Operator learning curve. Orbital and mechanized systems reduce training time, but they do not eliminate it. Six days of training on an orbital system was sufficient to bring skilled manual welders to 40–50 diameter-inches per shift, compared with 22 diameter-inches for manual operators. The productivity gain appears after the training, not on day one.
Workflow fit. An auto carriage welding machine that arrives at the joint faster than the fit-up crew can prepare the next joint does not increase throughput. The bottleneck moves. Productivity calculations assume the rest of the workflow can absorb the welding speed.
Flexibility value. A magnetic track welder that handles 10 different diameters without rail changes has operational value that the cycle-time formula does not quantify. That flexibility may justify a lower calculated productivity on a single joint if it eliminates the need for a second machine or the downtime of rail changes.
| Input | Your Value | Notes |
|---|---|---|
| Set-up time (min) | ___ | Measure on your actual joint |
| Welding time (min) | ___ | Sum all passes |
| Repositioning time (min) | ___ | Between passes |
| Repair rate (%) | ___ | From inspection records |
| Repair time per defect (min) | ___ | Grinding, re-weld, re-inspection |
| Effective shift minutes | ___ | Shift length minus breaks, meetings |
| Joints per shift (calculated) | ___ | 480 ÷ T_cycle |
| Equipment cost ($) | ___ | Including installation and training |
| Value per joint ($) | ___ | Labor + rework + schedule value |
| Payback (shifts) | ___ | Cost ÷ (Gain per shift × Value) |
The template is deliberately simple. It is designed to be filled in with observed data, not vendor claims. A circumferential weld productivity comparison that uses the same template for manual and automated systems makes the trade-offs visible — and makes the purchase decision defensible when the numbers are reviewed six months later.
For shops setting up a new system, the installation and alignment procedure covered in our guide to setting up a welding track carriage determines the set-up time input to this formula. And for shops still deciding between track and magnetic systems, understanding where magnetic adhesion reaches its limits — covered in our analysis of magnetic welding tractor applications — determines which input values are realistic for the circumferential weld work you actually run.
Divide effective shift minutes by cycle time per joint. Cycle time equals set-up time plus welding time plus repositioning time plus expected repair time. Measure each component on your own joints rather than using vendor estimates. A track welding machine with 25 minutes of set-up and 55 minutes of welding time will complete roughly 5 to 6 joints per 480-minute shift, depending on repair rate.
Repair time. A 1% repair rate on a 40-minute repair adds only 0.4 minutes to average cycle time, but repairs cluster and disrupt schedules. The difference between a 4% manual repair rate and a 1% mechanized rate often contributes more to productivity than the difference in travel speed. Automatic pipe welding productivity gains come from consistency, not just speed.
No. A magnetic track welder wins on set-up time and mixed-diameter work. A track welding machine wins on long production runs where rail setup amortizes and travel precision reduces repair rates. The cycle-time formula shows which advantage dominates for a given joint count and repair profile.
Typical payback on high-volume pipeline work is 1–3 years, with break-even around 300–500 girth welds on 16-inch and larger pipe. Shop-based fabrication with consistent joint configurations can pay back faster. The payback depends on the productivity gain per shift and the value per joint, not on the equipment price alone.
Yes. The cycle-time formula is process-agnostic. The inputs differ — manual welding has lower set-up time but higher repair rates; an auto carriage welding machine has higher set-up time but lower repair rates and faster welding time. Using the same formula for both makes the comparison transparent and prevents hidden costs from being excluded.
 TAG:
We value your message!
Please fill the below, We will customized the solution to your needs.