Stock Code: 831045
Industrial Automation & Intelligence Solutions
SUMMERY: In heat treatment, the cooling behavior of a quenching medium can influence the final properties of metal components. However, the actual cooling performance of an oil cannot be fully understood by checking its temperature or appearance ...
In heat treatment, the cooling behavior of a quenching medium can influence the final properties of metal components. However, the actual cooling performance of an oil cannot be fully understood by checking its temperature or appearance alone.
A cooling curve test provides a more systematic way to evaluate how a quenching medium removes heat from a heated probe.
A quenchometer performs this measurement by recording the probe temperature over time during immersion in the test medium. The resulting data can be used to analyze cooling curves and cooling rates.
This article explains how quenching oil cooling curve testing works, what information the results provide, and how ASTM D6200 and ISO 9950 are used in standardized testing.
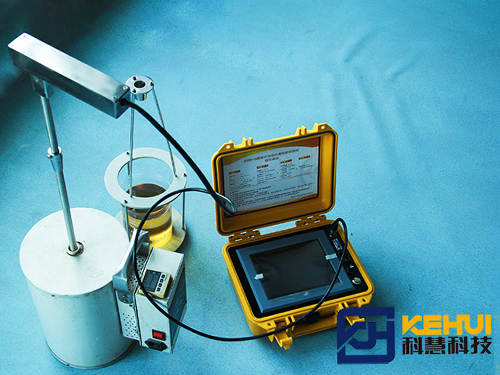
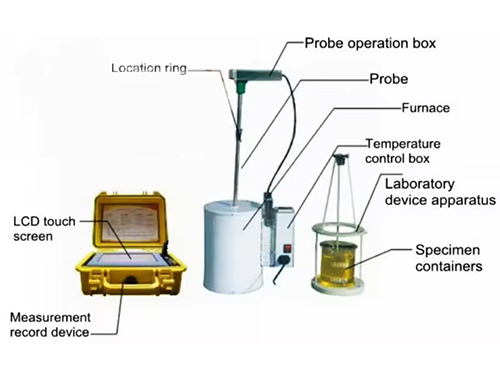
A quenchometer measures the cooling response of a heated probe after it is immersed in a quenching medium.
The basic principle is straightforward: the probe loses heat to the surrounding medium, and its temperature decreases over time. A temperature measurement system records this process, allowing the instrument to generate cooling data.
The general testing process includes five stages.
The test oil is placed in the appropriate container and prepared according to the selected test method.
Before testing, important conditions such as oil temperature, sample condition, and test setup should be checked. Consistent preparation is essential when comparing different samples.
The specified probe is heated to the required temperature.
For ASTM D6200 and ISO 9950 testing, a nickel-alloy probe is used. Its temperature is monitored during the cooling process.
The heated probe is transferred into the quenching oil under the conditions required by the test method.
As the probe contacts the oil, heat begins to transfer from the probe to the surrounding medium. Its temperature starts to decrease.
The quenchometer records the probe temperature over time.
The collected data forms the basis of the cooling time–temperature curve. The cooling rate curve can then be calculated from the temperature changes.
After the test, users can examine the curves to understand the cooling behavior of the oil.
Comparing results from different samples under the same test conditions can help identify differences in cooling characteristics or changes in the performance of an operating quenching oil.
A quenching oil cooling curve is a graphical representation of how the temperature of a heated probe changes over time during a cooling test.
It is one of the main outputs of quenching oil cooling curve testing.
The cooling time–temperature curve shows the relationship between probe temperature and elapsed time.
The curve helps users understand how the probe cools throughout the test. Its shape reflects the cooling behavior of the medium under the specified test conditions.
For example, when two oils are tested using the same method, their curves can be compared to identify differences in temperature reduction over time.
The cooling rate curve shows how quickly the probe temperature changes during the cooling process.
It is derived from the temperature–time data and represents the rate of temperature change at different stages.
The cooling rate is not constant throughout the test. It changes as the probe temperature decreases.
This distinction matters because two oils may have similar overall cooling times but different cooling rates within particular temperature ranges.
In simple terms, the cooling curve shows how the temperature changes, while the cooling rate curve shows how fast it changes.
Cooling curve analysis provides useful information for comparing quenching media and monitoring changes in their cooling characteristics.
Oil manufacturers may need to compare several formulations during product development.
Testing the samples under the same conditions allows technical personnel to compare their cooling curves and evaluate differences in cooling behavior.
A heat treatment plant may compare a sample of new oil with a sample taken from an operating quenching tank.
If the cooling curves differ, the result may indicate a change in the oil’s cooling characteristics. Further investigation can then consider factors such as oxidation, contamination, water content, and operating conditions.
Regular testing can help establish a record of how a quenching medium performs over time.
When results are compared with previous measurements or internal control limits, users can identify changes that may require further examination.
However, a cooling curve does not independently identify every cause of a change. It should be interpreted together with oil condition information and actual production performance.
ASTM D6200 and ISO 9950 are two recognized methods used to determine the cooling characteristics of industrial quenching oils.
Both use a heated nickel-alloy probe and evaluate the cooling behavior of the test oil under prescribed conditions.
| Item | ASTM D6200 | ISO 9950 |
|---|---|---|
| Main purpose | Determination of quench oil cooling characteristics | Determination of industrial quenching oil cooling characteristics |
| Test principle | Cooling curve analysis | Nickel-alloy probe test |
| Probe | Nickel-alloy probe | Nickel-alloy probe |
| Test environment | Non-agitated oil system | Non-agitated oil system |
| Main application | Evaluation and comparison of quenching oils | Evaluation and comparison of industrial quenching oils |
Although the two methods share a similar testing purpose, they are separate standards with their own prescribed procedures and requirements. Results should be interpreted according to the method actually used.
The KHR-A Quenchometer developed by Kehui supports both ASTM D6200 and ISO 9950 testing methods.
One important limitation should be noted: these methods are specifically associated with industrial quenching oil testing. They should not automatically be treated as universal methods for every water-based quenchant or polymer solution.
In industrial heat treatment, consistent production requires control over several factors, including material composition, heating conditions, transfer time, quenching medium condition, and cooling behavior.
Cooling curve testing helps monitor the quenching medium as one part of this wider quality control system.
For example, if a heat treatment plant begins to observe variations in the hardness of finished components, the technical team may need to investigate several possible causes. These could include heating conditions, material differences, quenching temperature, agitation, and oil condition.
A cooling curve test can help determine whether the quenching medium’s cooling characteristics have changed.
It does not replace hardness testing or metallurgical inspection. Instead, it provides additional data that helps engineers investigate the quenching process more systematically.
For laboratories and industrial users that need to measure quenching oil cooling characteristics, selecting suitable testing equipment is important.
The KHR-A Quenchometer is developed and manufactured by Kehui, a Chinese industrial equipment manufacturer established in 1994.
The instrument supports ASTM D6200 and ISO 9950 testing methods and is designed for specialized quenching medium cooling characteristic measurement.
Kehui has long-term experience in this equipment field and is now expanding its KHR-A Quenchometer business into international markets.
For overseas customers, working directly with the manufacturer also provides an opportunity to discuss test method requirements, equipment suitability, and technical support.
A common approach is to conduct a cooling curve test using a heated probe. The probe is immersed in the oil under specified conditions, and its temperature is recorded over time. The data is then used to analyze the oil’s cooling characteristics.
The cooling rate is calculated from the change in probe temperature over a period of time. A quenchometer records the temperature data, from which the cooling rate curve can be generated.
A cooling curve shows the relationship between temperature and time. A cooling rate curve shows the rate of temperature change during the cooling process.
Used oil may experience changes due to aging, oxidation, contamination, water ingress, and operating conditions. Testing helps identify changes in cooling characteristics and supports further oil condition evaluation.
ASTM D6200 is a method for determining the cooling characteristics of quench oils. It should not be assumed to apply directly to all water-based quenching fluids or polymer solutions. The appropriate testing method should be selected according to the medium and applicable technical requirements.
Kehui’s KHR-A Quenchometer supports both ASTM D6200 and ISO 9950 testing methods for industrial quenching oil cooling characteristic measurement.
Understanding the cooling characteristics of a quenching medium is an important part of heat treatment process monitoring.
Whether you are comparing quenching oil products, evaluating used oil, or establishing a laboratory testing procedure, a suitable quenchometer can provide valuable cooling curve data.
Kehui manufactures the KHR-A Quenchometer for industrial users and laboratories seeking specialized quenching oil testing equipment.
Contact Kehui to learn more about KHR-A and discuss your cooling curve testing requirements.
 TAG:
We value your message!
Please fill the below, We will customized the solution to your needs.